Data Visualization
Using Data Visualization to Realize Return on Smart Grid Investments
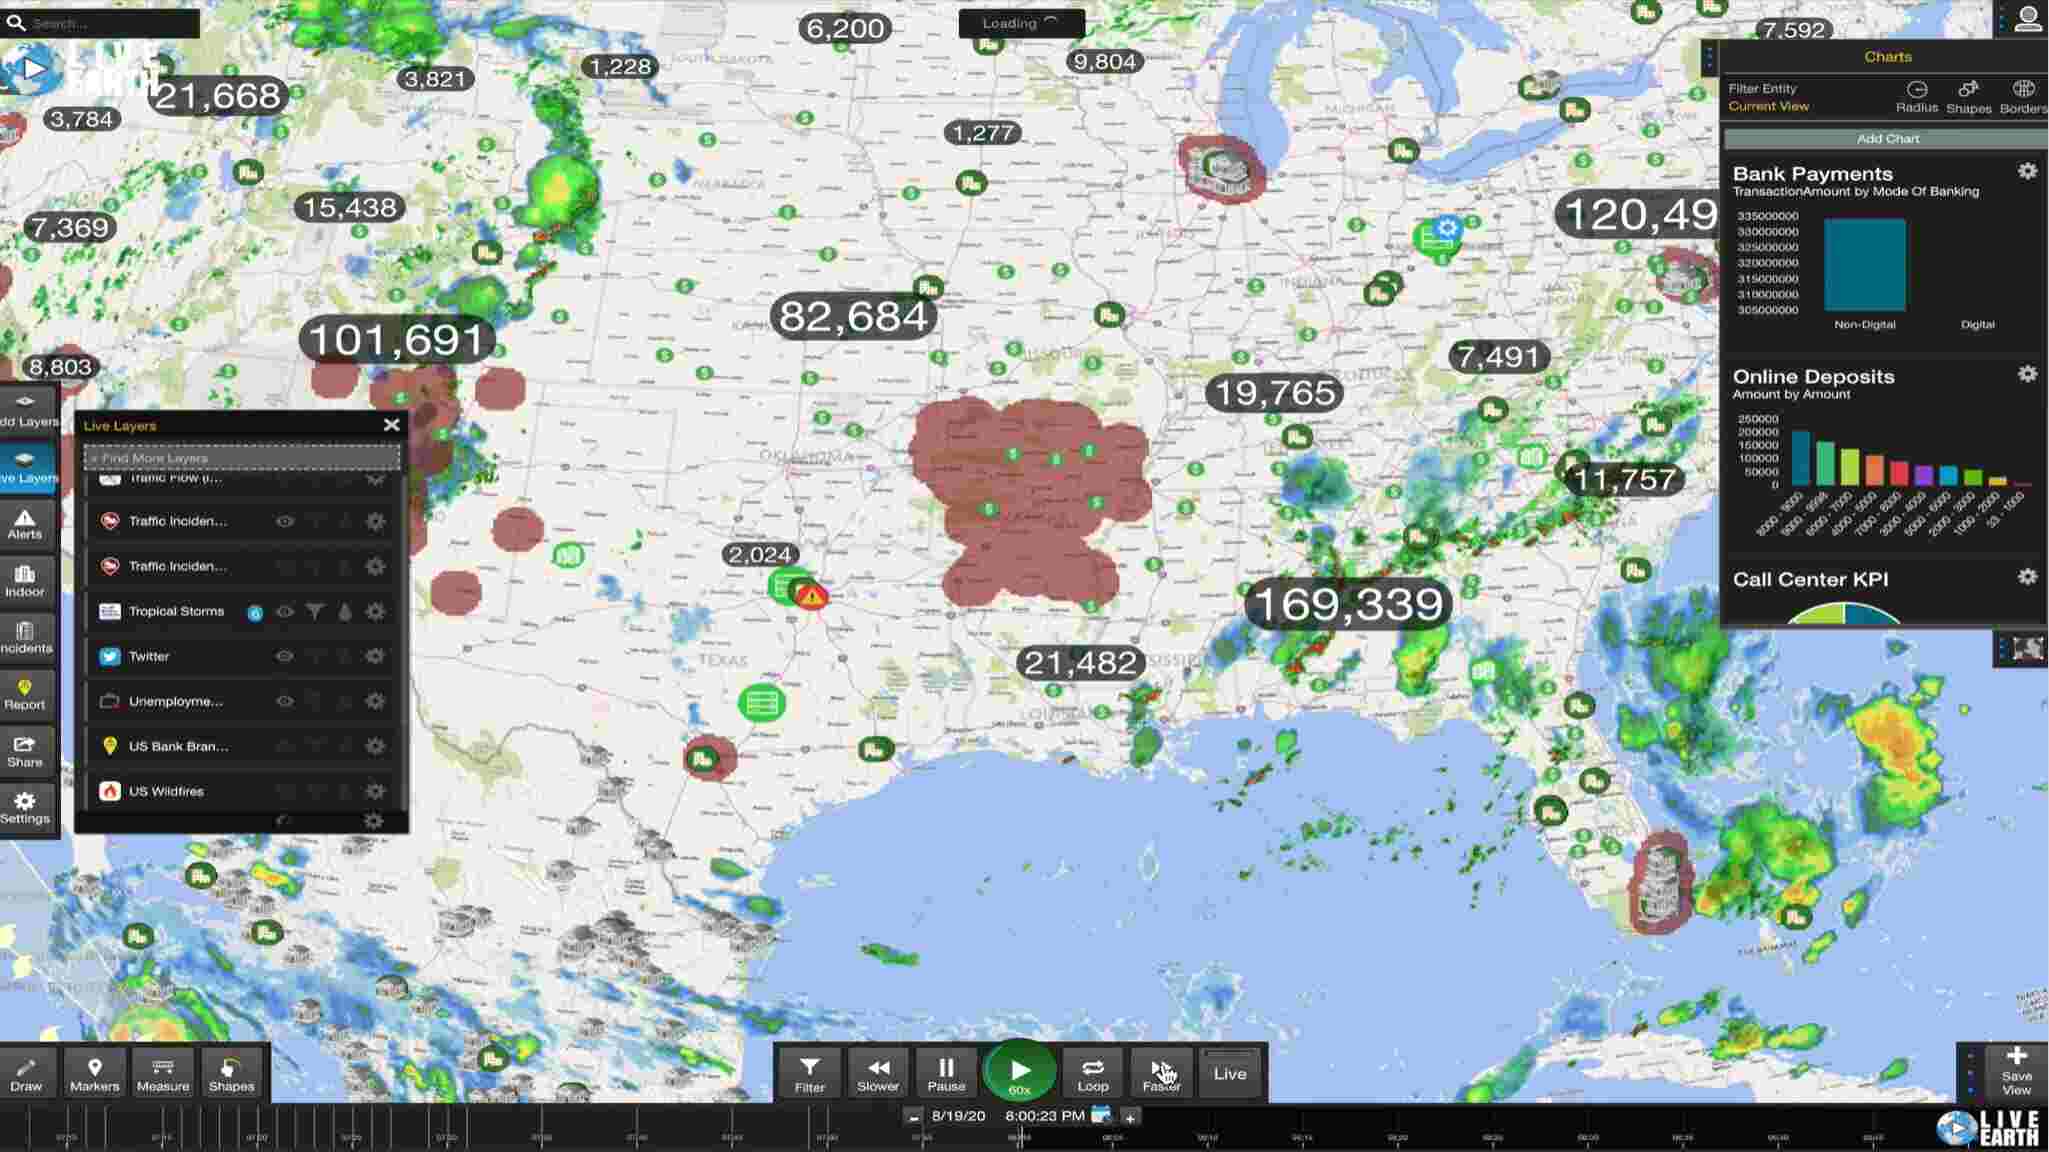
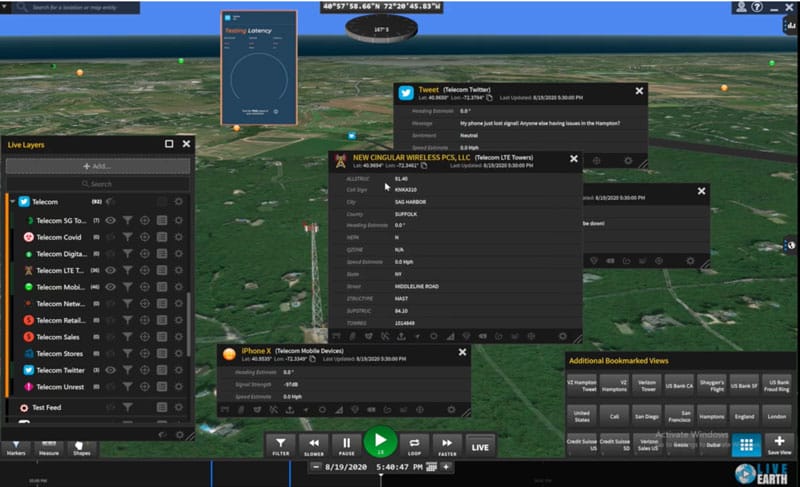
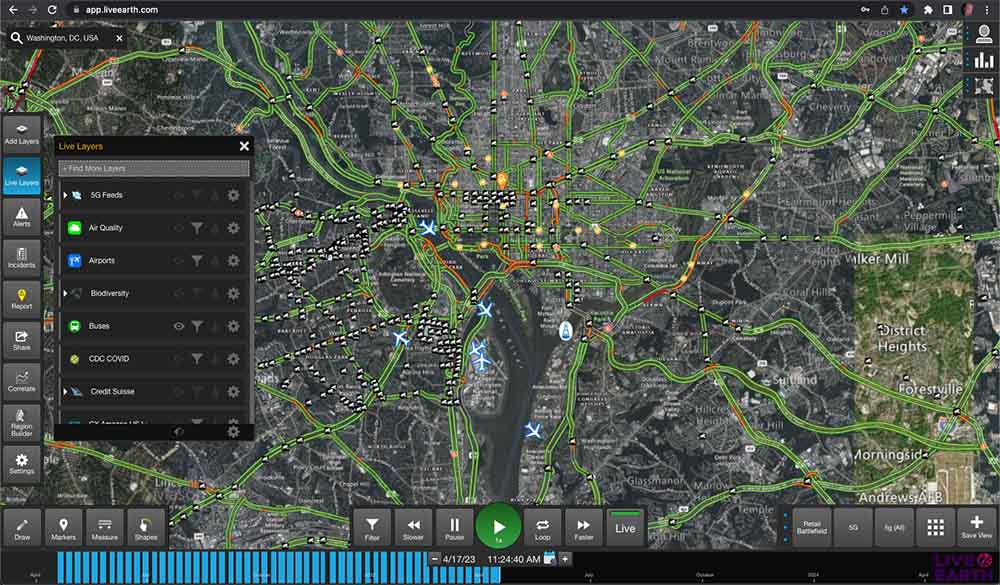
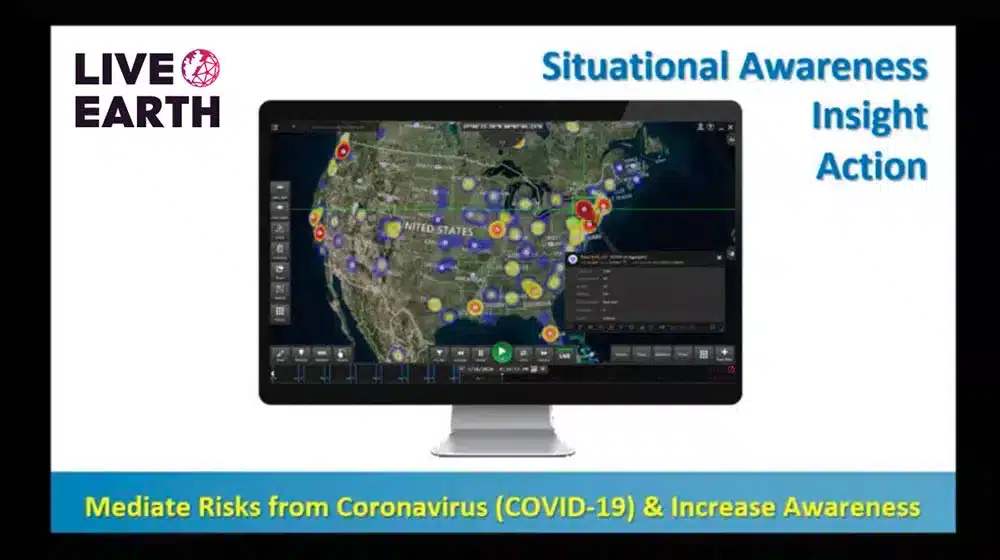
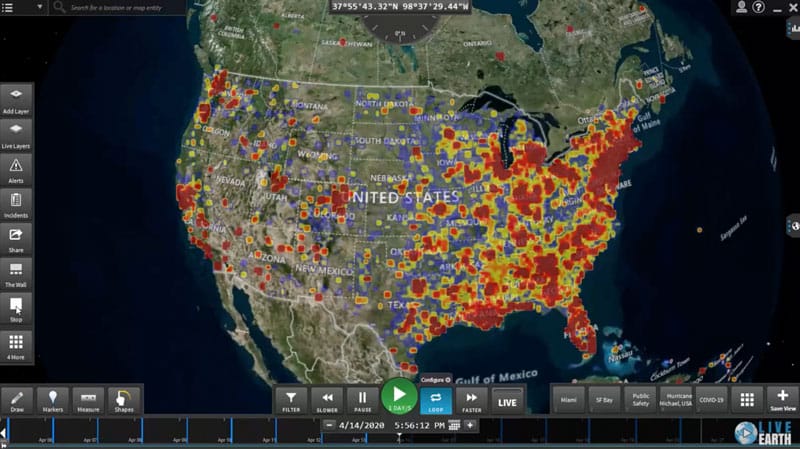
Data visualization is the graphical representation of data and information using visual elements such as maps, charts, infographics, tables, dashboards, and graphs. To better understand